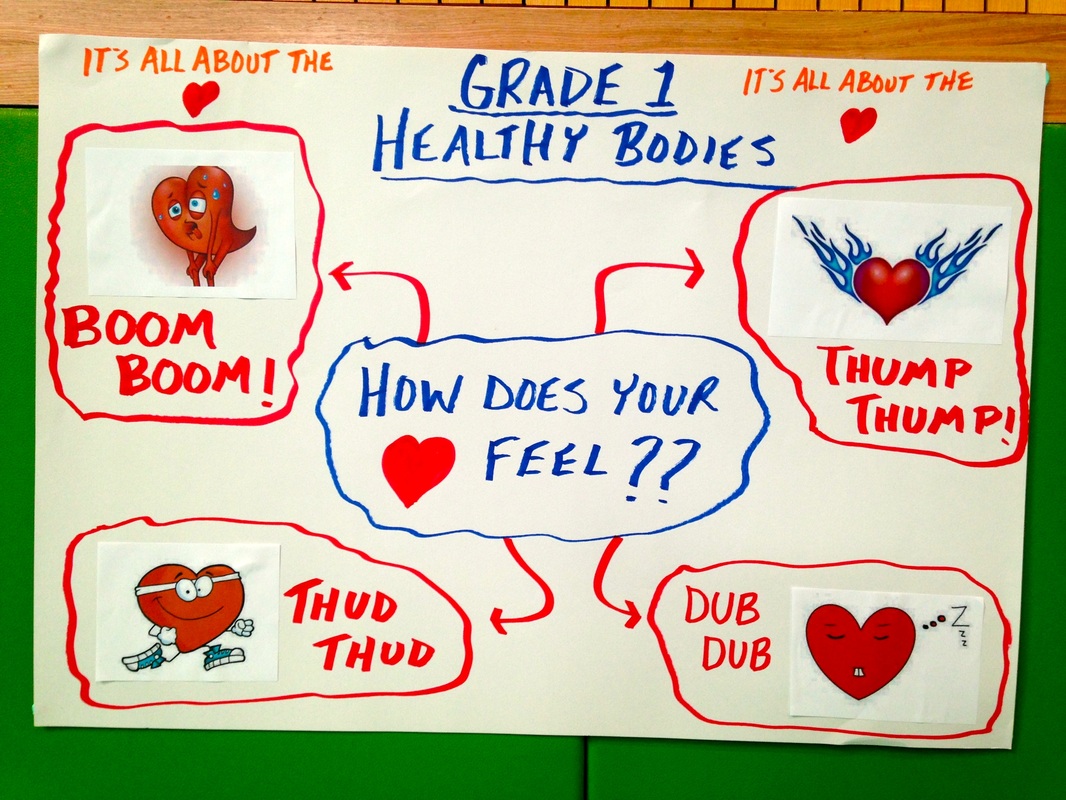
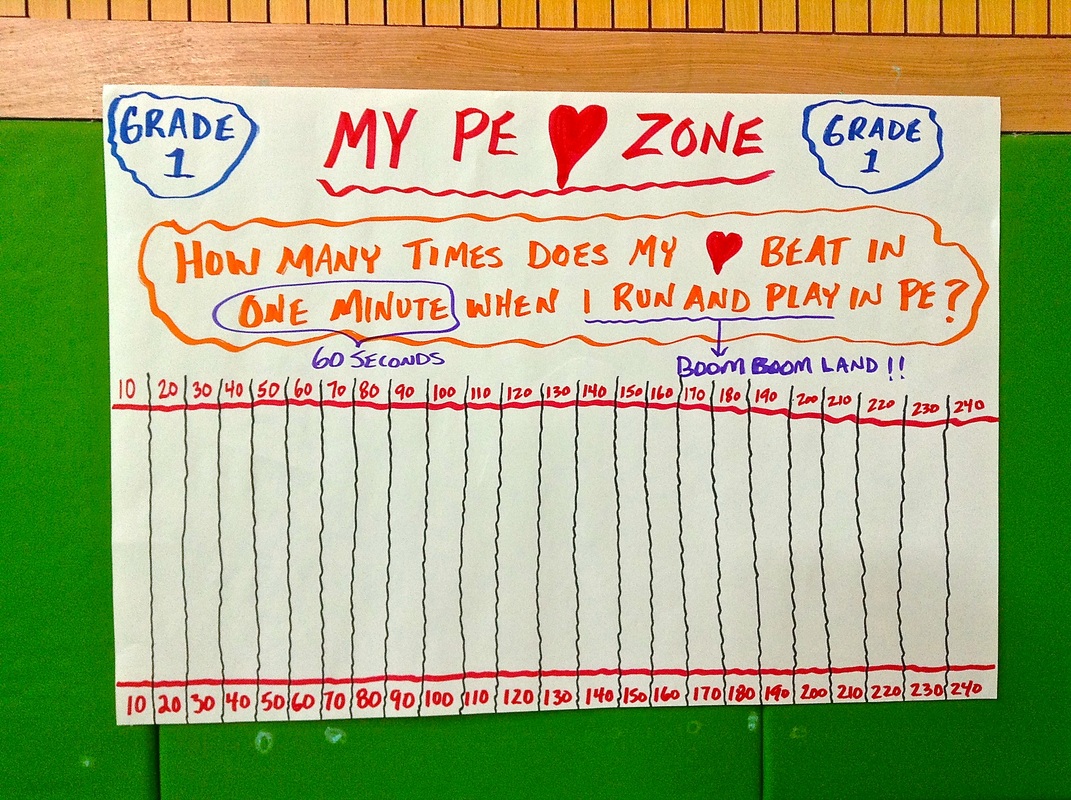
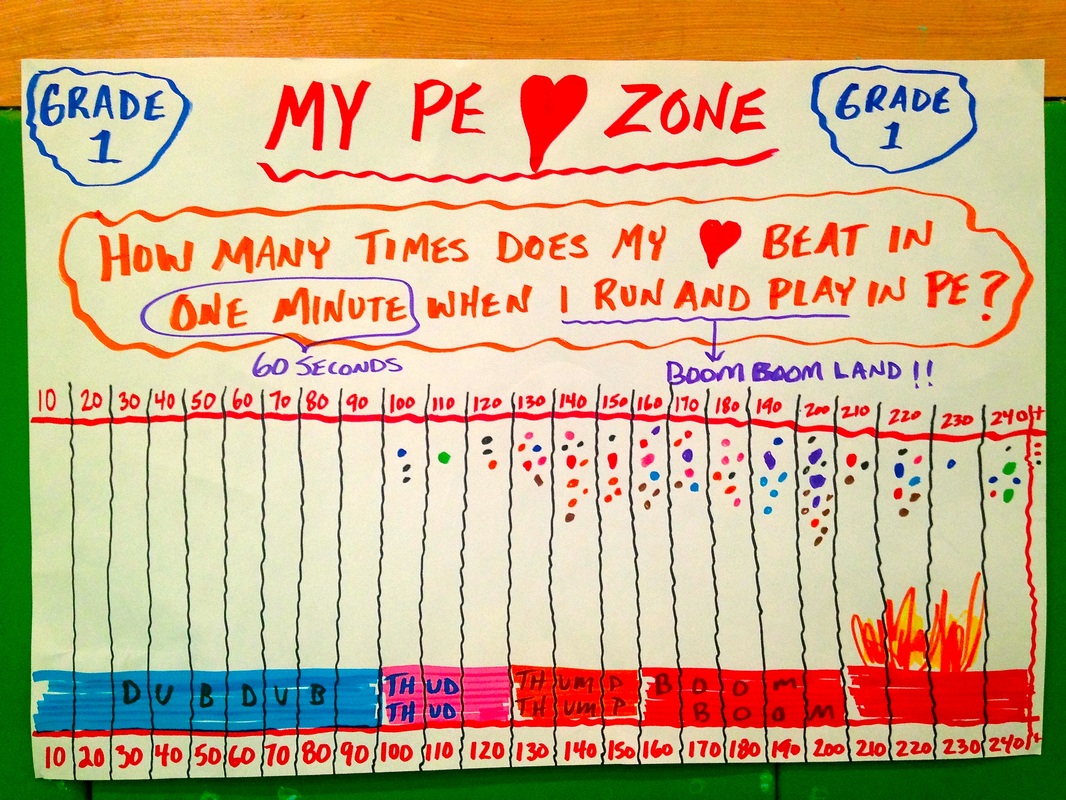
Getting young ones to understand different heart rate zones in PEWe are now in the third week of our Health Related Activities unit in grade 1. The students have been engaged in a number of different types of physical activity with the aim being to be able to describe how their bodies change while exercising and playing. They know and understand the big changes that take place, but over the past 2 weeks, I have narrowed things down so that they are focusing exclusively on heart rate. In order to get them to understand the different heart rate zones, we came up with words to describe what the heart might sound like while being physically active at different levels of intensity. Check out the visual below. To break things down further, I have had them busy at work being super active, but every few minutes I get them to stop, find their heart beat by placing their fingers on the carotid artery on the side of the windpipe, and count the number of heart beats in 6 seconds. I use a stop watch to time this by saying "Ready, Steady, Count" and after 6 seconds "Stop Counting". I have shown them that they must include a zero at the end of the number giving them the number of heart beats in one minute. For example, if the student counts 14 beats in 6 seconds then add the zero to the end of this, they come up with the number 140. It took some practice, but most are able to understand this math place value concept. I have explained to them what doctors want to know is how many times their patients hearts beat in one minute, so my young ones now know that this is what I want them to know in regards to their own heart rates. But, instead of giving them the answers, over the past couple of classes, I decided to create another visual that would allow me to plot their heart beats on a chart. See this visual below. My goal was to continually plot their heart rates over 2 classes in order to establish a pattern for them to see. As the classes progressed the chart got more and more filled up in the proper areas. If students said a number that was way too high, instead of saying "You've made a mistake", I still plotted it into the plus 240 BPM section at the far right. Over time, the students began to see a trend and were able to understand that perhaps they had been counting wrong and needed help.
At the end of today's PE class, I added in the heart rate zones according to the sound visual that we created a few classes ago (the visual you see at the top of this blog post (Dub Dub, Thud Thud, Thump Thump, and Boom Boom). I drew an an image of the heart on fire in today's class in the visual below to represent heart rates that are higher than the zones that we want them to be in. The students walked away from today's class hopefully knowing that the zone that they should be in when they are active in PE is between 140-200 beats per minute. Most students seemed to grasp this, so for the one's that are still struggling I can work more specifically with them over the next couple of classes.
1 Comment
Michel Xhauflair
11/19/2014 12:22:02 pm
Hi Andy,
Reply
Leave a Reply. |
AuthorKAUST Faculty, Pedagogical Coach. Presenter & Workshop Leader.IB Educator. #RunYourLife podcast host. Archives
September 2022
|
- Welcome
- All Things Teaching and Learning
- The Aligned Leader Blog
- Consulting and Coaching Opportunities
- My TED X Talk
- My Leadership Blog
- Run Your Life Podcast Series
- How PYP PE with Andy Has Helped Others
- Good Teaching is L.I.F.E
- The Sportfolio
- Example Assessment Tasks
- PYP Attitude Posters (printable)
- Publications


 RSS Feed
